Automated Software Architecture Visualization & Emergent Understanding
TL;DR: Over the past decade, we have seen a “renaissance” of software systems architecture visualization in the form of automatically generated visualizations from artifacts of the deployed systems. These approaches provide teams with an increased awareness of the running software systems in and across teams’ scopes of work. These open doors for organizations to better understand, navigate and design how to evolve their products since they provide unprecedented awareness. Such developments also allow for what I call “emergent understanding”. We can see things we wouldn’t usually see in our previously manual approaches because we would take more narrowed views. I end the article reflecting on what I think are the upcoming vital developments on this topic, namely considering the perspective of the social systems that are driving these technical systems architecture.
- Introduction
- Key enablers for scalable \& automated software system architecture visualization
- Informational architecture as a driver for emergent understanding and better aspirational architecture
- Going beyond technical systems visualization
- Final Note
- References
- Tools and Products
- Conversation
Introduction
The (r)evolution of the software systems architecture will be visualized in real-time. We are seeing a renaissance of software systems visualization with a strong focus on (always up-to-date) automatically generated visualizations created from artifacts and descriptions of the running systems. Among others, the work from Simon Brown has made considerable contributions to shaping these new and more sustainable approaches to software architecture visualization. For example, his work on the C4 Model language [C4], but also with Structurizr tool [Structurizr].Furthermore, we are also seeing the productization and commoditization of many other tools and platforms. This move allows companies to adopt these software systems visualization approaches quickly. A great example is Backstage [Backstage], a platform developed internally by Spotify for software systems visualization. Backstage has been released as an open-source project. It is now being adopted by many companies and getting contributions. You can find many other interesting tools Tools & Products section at the end of the article.
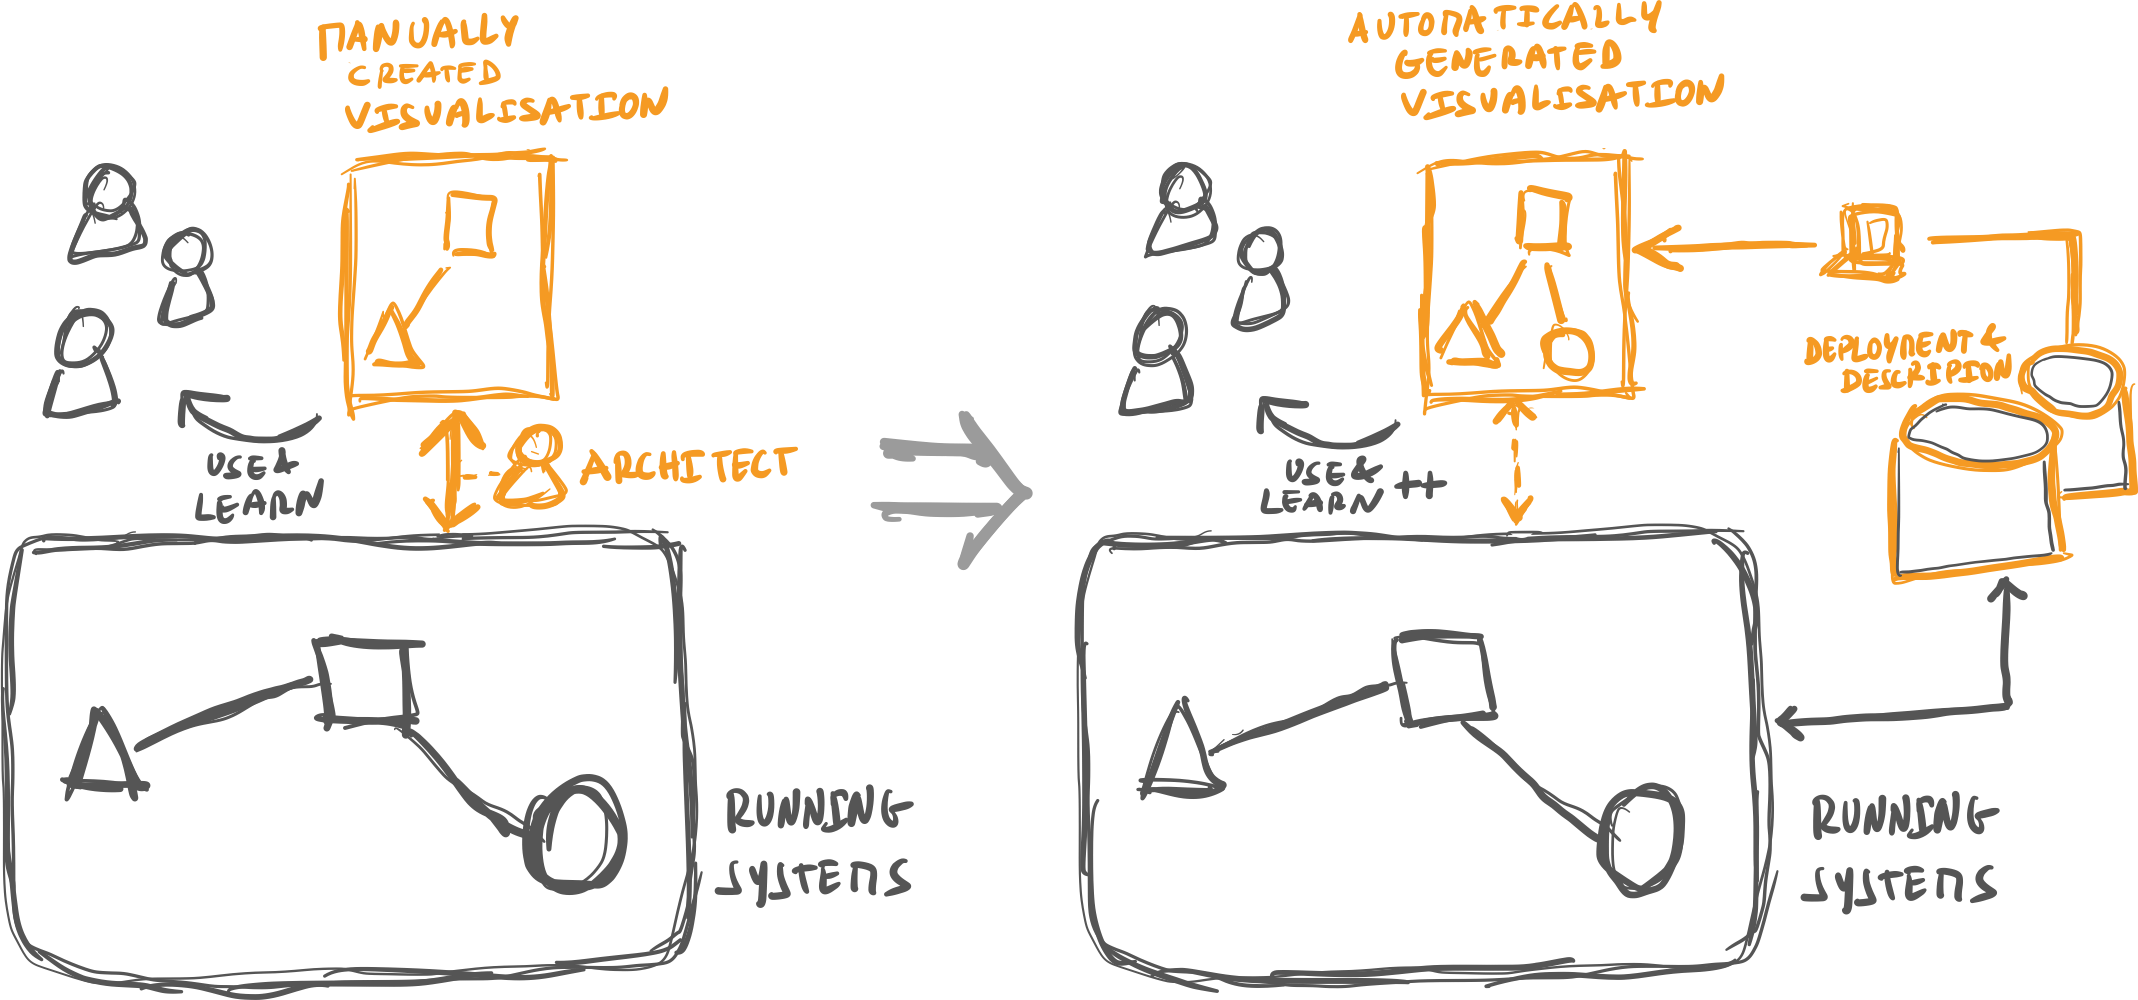
The figure above depicts the fundamental transformation I am seeing on this topic of software systems architecture visualization. It is about moving from manually created visualizations to ones automatically generated from deployment and description artifacts. This transformation provides a clearer and consistently up-to-date view of the deployed systems across our teams. Manually maintained visualizations are complex, which is why these automation tools are needed. Having “architects” (and/or teams) always keep these visualizations up-to-date is challenging. Furthermore, with automation, we open doors for broader and deeper insights (in teams and across teams), given that teams can visualize their scope and the whole landscape. The move to automated visualizations enables what I call “emerging discovery and understanding”: an increased ability to visualize and understand our scope of work continuously. It also allows visualizing other parts of the landscape we previously had no insights into. This new and improved information and understanding allow us to discover and shape new options, designs, and evolution paths. Those would have been difficult to discover in more classic manual approaches. The outcome of this broader and deeper understanding should allow for better decisions and, consequently, better ways to navigate the natural complexity of our software systems architecture. It is essential to acknowledge that these approaches will not be effective if the culture and structures in the organization don’t allow that “emerging discovery and understanding” to happen. That would mean that there are some excellent ideas. Still, teams are not empowered to explore options, collaborate and decide. This vital topic goes outside the scope of this article - however, I cover it in other articles [Sociotechnical-Silva].
I reflect on the positioning of these developments and more traditional manual approaches to architecture visualization. In particular, we can leverage them to enable a more “emergent understanding” to improve our systems’ design. In the rest of the article, I will look at some of the key elements and enablers of these more scalable approaches to software systems architecture visualization: the languages, the platforms, and the state of their commoditization. I end the article by reflecting on what I see as some key future developments on these topics. In particular, ones that allow considering the social systems building the software systems architecture. A “sociotechnical” approach should allow us to achieve an even more sustainable evolution of our systems.
Key enablers for scalable & automated software system architecture visualization
In this section, I reflect on some core elements enabling this transition to a more automated generation of software architecture diagrams. This approach should also allow a more scalable way to support the visualization of software systems. I also share some notes on some first-hand experiences from witnessing the journey of bol.com (the biggest online retailer in the Netherlands and Belgium) on noticing the need for this capability, finding ways to approach it, and the journey to adapt it over time.
Languages to describe software system architecture
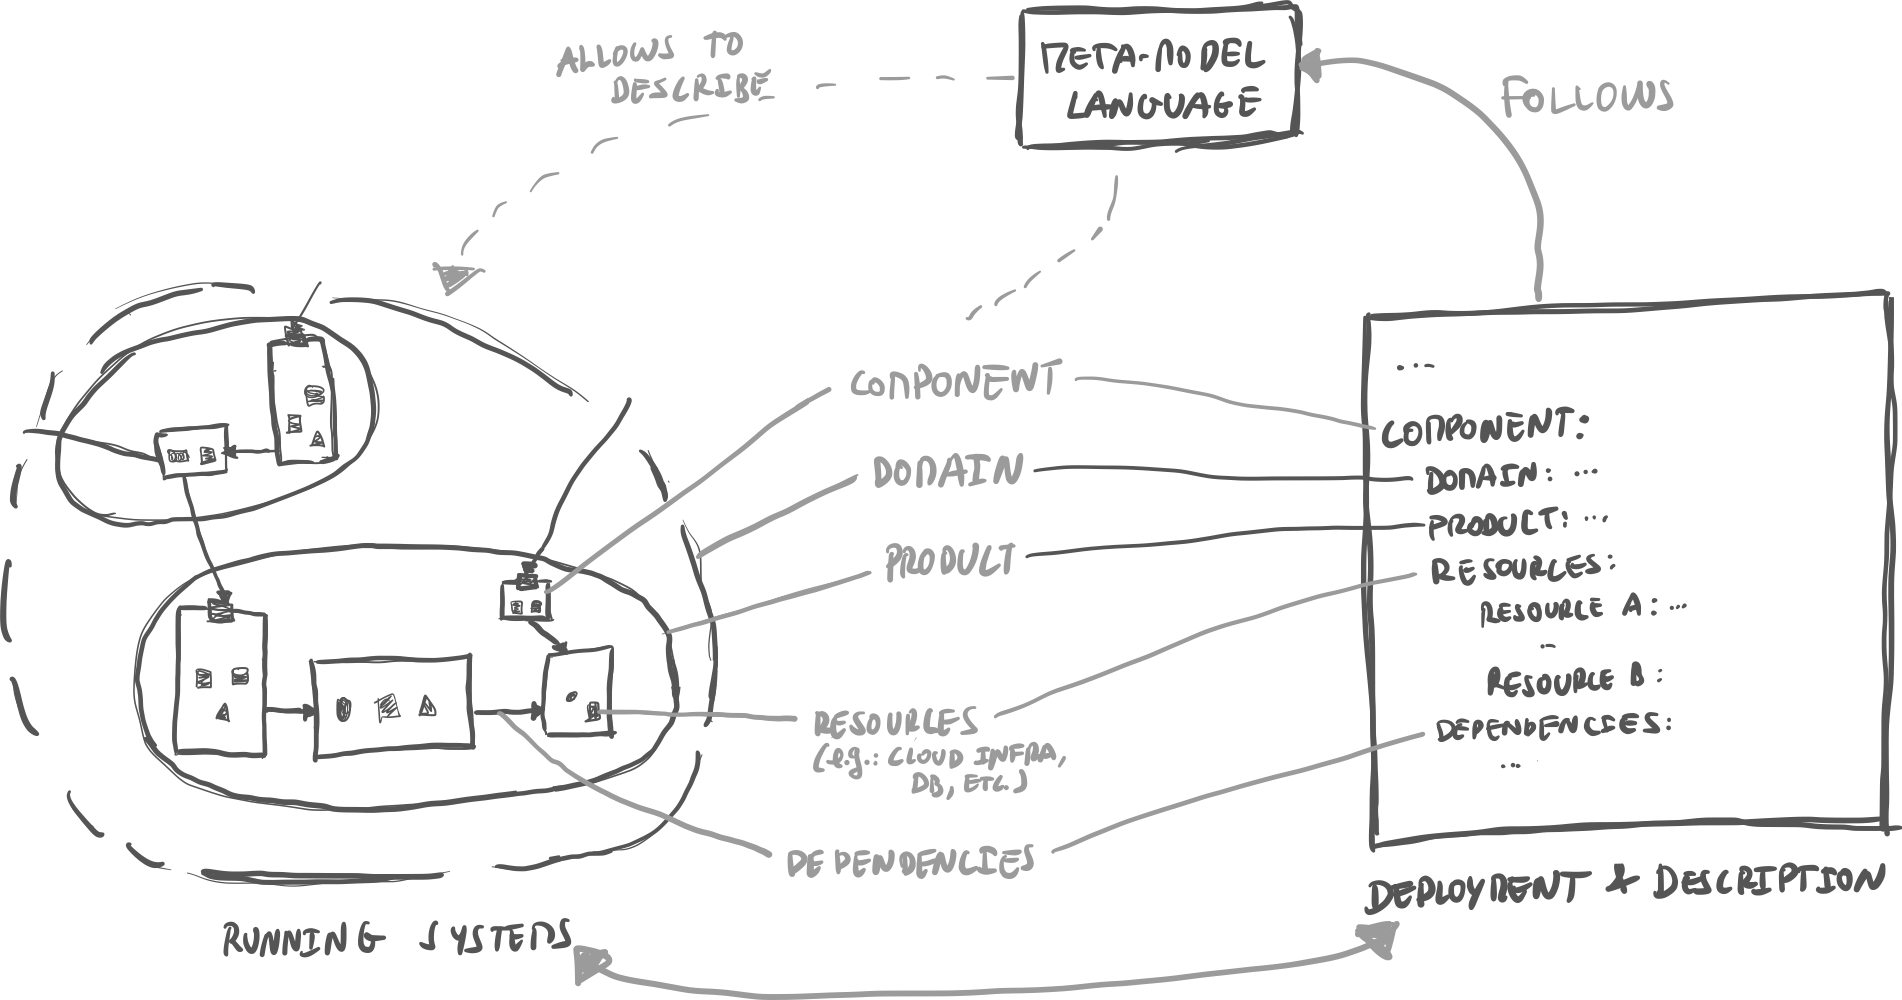
Recently, Spotify published an interesting article sharing key learnings and insights on their journey towards defining an approach to visualize their software systems architecture [Spotify-ArchitectureVisialization]. They reflect on several things, but the most foundational one is shaping and evolving their (meta)model and language to describe software systems architecture in the organization. Their first model mainly described services, applications (”components”), and low-level resources. This allowed teams to model the software architecture within their scopes of work. However, in time they saw the need for extending the model to also account for describing higher-level scopes in the systems architecture. The goal was to enable capturing scopes formed by multiple components (and possibly teams) and their interrelations. Based on that, they introduced new concepts, such as “System” and “Domain”. These new elements connect the finer-grained scopes that tend to exist within a team’s scope of work to bigger scopes, where multiple components and teams may coexist. Such evolution becomes essential to understanding and approaching the evolution of the systems in the different scopes and teams. This (continuously evolving) model has become Spotify’s “standardized software metadata model to create a common language for communicating software architecture”. These elements allow for a consistent description of the different elements in the landscape, which in turn allows the automatic visualization of the software systems architecture in the organization. The following figure showcases these fundamental ideas. We have “description and deployment files”, which follow the standardized meta-model language representing the deployed elements of the running systems. That forms the basic foundation to have a consistent way to describe the running systems and visualize the software systems architecture of the organization.
bol.com experience: bol.com has had a similar journey in developing language and customer tools to support the automatic generation of the software systems architecture visualizations. The main motivations for these “custom developments” started around 2016-2017 to respond to the ever-increasing number of services and applications. Furthermore, it was also a reaction to a rapidly growing business, with many empowered teams (100+) working in clear scopes of work. The rapid growth of the organization, and its systems, started making it very challenging to keep track of the things happening in the landscape and have a good understanding of how to evolve it. Like Spotify, the first steps focused on creating ways to describe the “services and applications” of each team. With that, teams could easily maintain an overview of their scope. However, this also allowed teams to “discover” and visualize components from other teams in the landscape. In time we started adding new elements to the language and tools, such as the ability to describe “interrelations” between the different systems. Eventually, we also incorporated elements to describe larger scopes of work: “Products”, which are composed of multiple applications and services, possibly owned by different teams. Like Spotify, we also had the notion of “Domains”, which were natural domains within the organization, composed of multiple “Products”. All these language evolution iterations strongly correlate with organization structure evolution (e.g., the introduction of Product scopes).
Platforms for decentralized software systems architecture visualization
A standard language (or “meta-model language”) provides the means to have a decentralized description and mapping of the key elements of the software systems architecture (resources, services, products/systems, etc.). Each team can describe its scope of work components and its interrelations with other system components. Then, all those descriptions can also be used to “render” visualizations of the whole landscape without the need to have a single person or group do that manually and centrally. Furthermore, and very interestingly, the descriptions teams need to create can be built upon existing artifacts they develop or use. For example, teams already use configuration and deployment files daily. This offers opportunities to leverage those artifacts and decrease the efforts to maintain these descriptions. Given that these artifacts are always a mirror of the running systems, we ensure that we have an always up-to-date visualization of the “deployed architecture”.
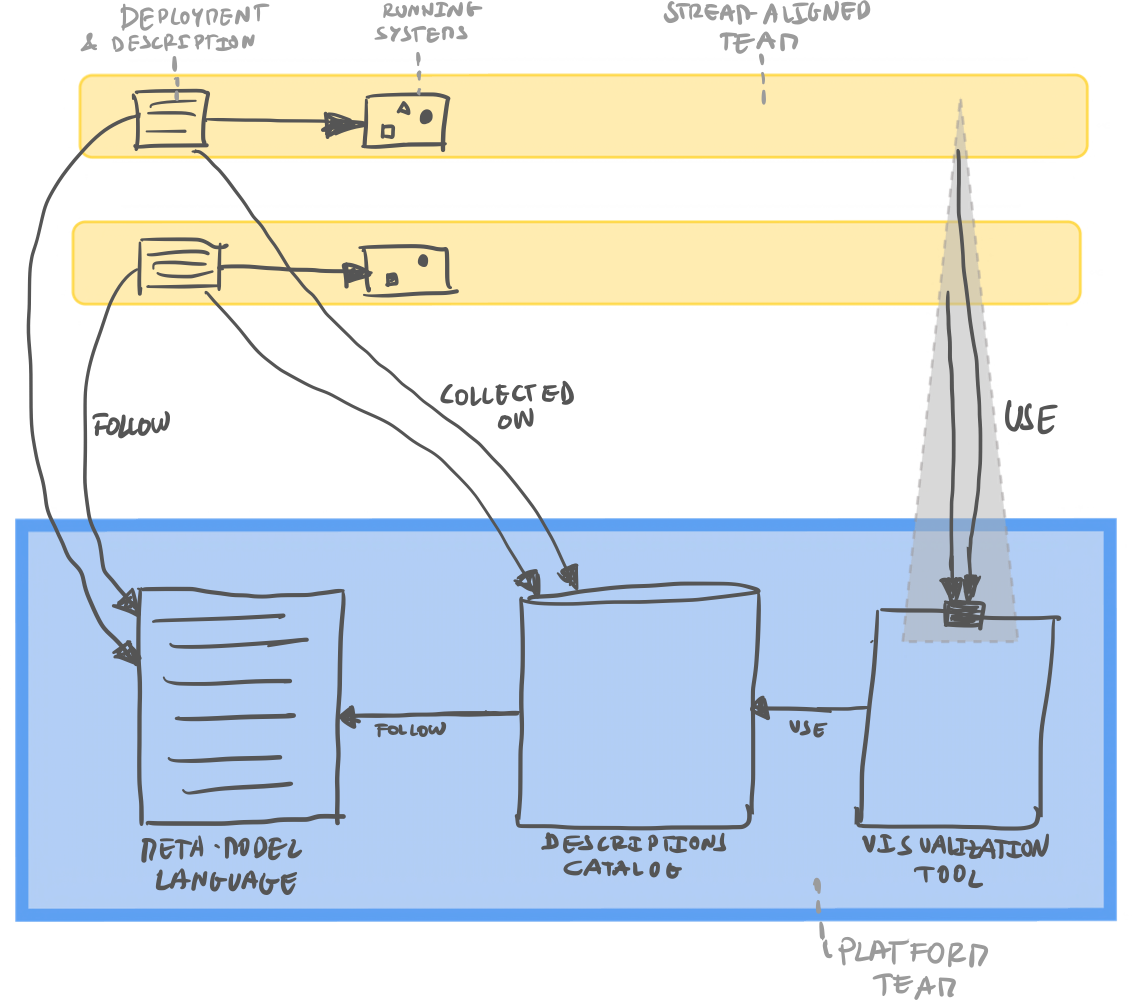
By now, we can agree that these elements can be powerful enablers in the organization. However, the question is: how can we shape, evolve and maintain the language and supporting tools required to achieve this? As we saw from Spotify and bol.com experiences in the previous section, the language and tools will change over time. Such challenges mean that we need people continuously caring for those elements so that all the teams in the organization can leverage their value. The bottom line is that this is not a one-time project but an internal product that will evolve. To support that, I consider that having a “platform team” (as in Team Topologies [Team-Topologies]) is a good strategy to approach this. This team (or teams) can develop and consolidate the standard language and all tools that support the lifecycle of describing and visualizing the elements of the software systems architecture for the whole organization. This support ensures that those foundational elements evolve with the organization’s needs (for example, sometimes, we will add new elements or make certain changes to the existing models). That means that having clear ownership of these elements is key. That team guarantees that this product is easy to use and continuously available, so all teams can rely on it and be more effective in their work. In the following figure, I share an overview of the relevant elements of such a platform. I use Team Topologies diagraming language [Team-Topologies-Diagramming]. We have “Stream-Aligned Teams” (or Product Teams) describing their running systems using a standard language. Those descriptions are collected into a central descriptions catalog, which is then used to power the visualization tool. Both of these components are owned by the platform team. That visualization tool allows teams to perform different queries as needed, so they can explore the landscape and improve their designs and decision-making.
bol.com experience: at bol.com the genesis and evolution of the language and platform tools for the decentralized software systems visualization was a rather interesting one. These activities were initially driven by a few pioneers (architects and software engineers). They have created a custom application and language, including a handy graph visualization and navigation of the landscape [Software-Parade]. That application would “mine” different deployment and configuration files from teams (e.g., deployment configuration files and other system description files). Those elements would be used to power the visualization of the applications and services in the landscape. So this meant that teams had little to no overhead efforts during this process. Most of the information is harvested from different deployment and configuration files, which teams already use in their day-to-day activities. It made this a very elegant and “non-blocking system”, which quickly started providing a lot of value for everyone with its visualizations and discovering capabilities. However, things started becoming challenging when 100+ teams increasingly used this system. The initial team faced challenges in providing the level of support it needed. Funny story: that team once deliberately “turned the system off” for a good while to see what the impact would be. Outcome: many people were rather unhappy with that and made it clear in many communication channels of the organization. That was a great “value validation” and helped make the case that a more sustainable model was needed to own, scale and evolve these tools. That was what happened: it became part of one of bol.com’s platform teams, which provided the necessary support to keep it running smoothly and evolving as needed. Nowadays, it continues to be a structural element in the organization. It is used by product teams and anyone interested to discover and understand the software systems landscape and other elements added to the language in time.
Commoditization of automatic generation of software systems architecture visualization
Nowadays, we are seeing the ideas and tools shared in the previous section becoming more mainstream and, in a sense, becoming “commoditized”. For example, as mentioned earlier, Spotify has released its platform tool, Backstage [Backstage], as an open-source project. This tool is the outcome of their learnings on growing their internal platform to support software systems architecture visualization at scale. Given that, Backstage started providing a solid and flexible platform to support the decentralized description of software architecture “components” (resources, services, etc.) and, based on that, its discovery and visualization (among other things). Another important feature of Backstage is that it is a plugin-based architecture, which means organizations can extend it to their particular needs. This flexibility is crucial for these platforms since each organization will have specific context and needs, including different tools and platforms to describe their resources, applications, etc. Furthermore, organizations and people are sharing their plugins and collaboratively improving this platform faster while creating a robust ecosystem of tools. These developments should further commoditize the tools in this space, making it even simpler for even more companies to leverage these.
bol.com experience: interestingly enough, bol.com also noticed the emergence of different tools and platforms to better support this capability, including Backstage. Backstage led to work on replacing the homegrown application, which was initially necessary, given that there was no reliable solution in the market. This change showcases the points I want to make in this section: we are seeing the commoditization of tools to support the automatic generation of software systems architecture visualizations. Furthermore, this also shows an interesting strategy for organizational evolution: it is critical to acknowledge that our landscape and the environment surrounding it are continuously evolving. In particular, we must embrace and accept the strategic replacement of in-house developed components, in particular ones that stop becoming unique and differentiating in our business. Commodity platforms that become market leaders (and are continuously improving) should replace those in-house developed components. Those transformations enable us to leverage those products and platforms to our advantage and use “our precious brains” on our organization’s unique and differentiating problems.
Informational architecture as a driver for emergent understanding and better aspirational architecture
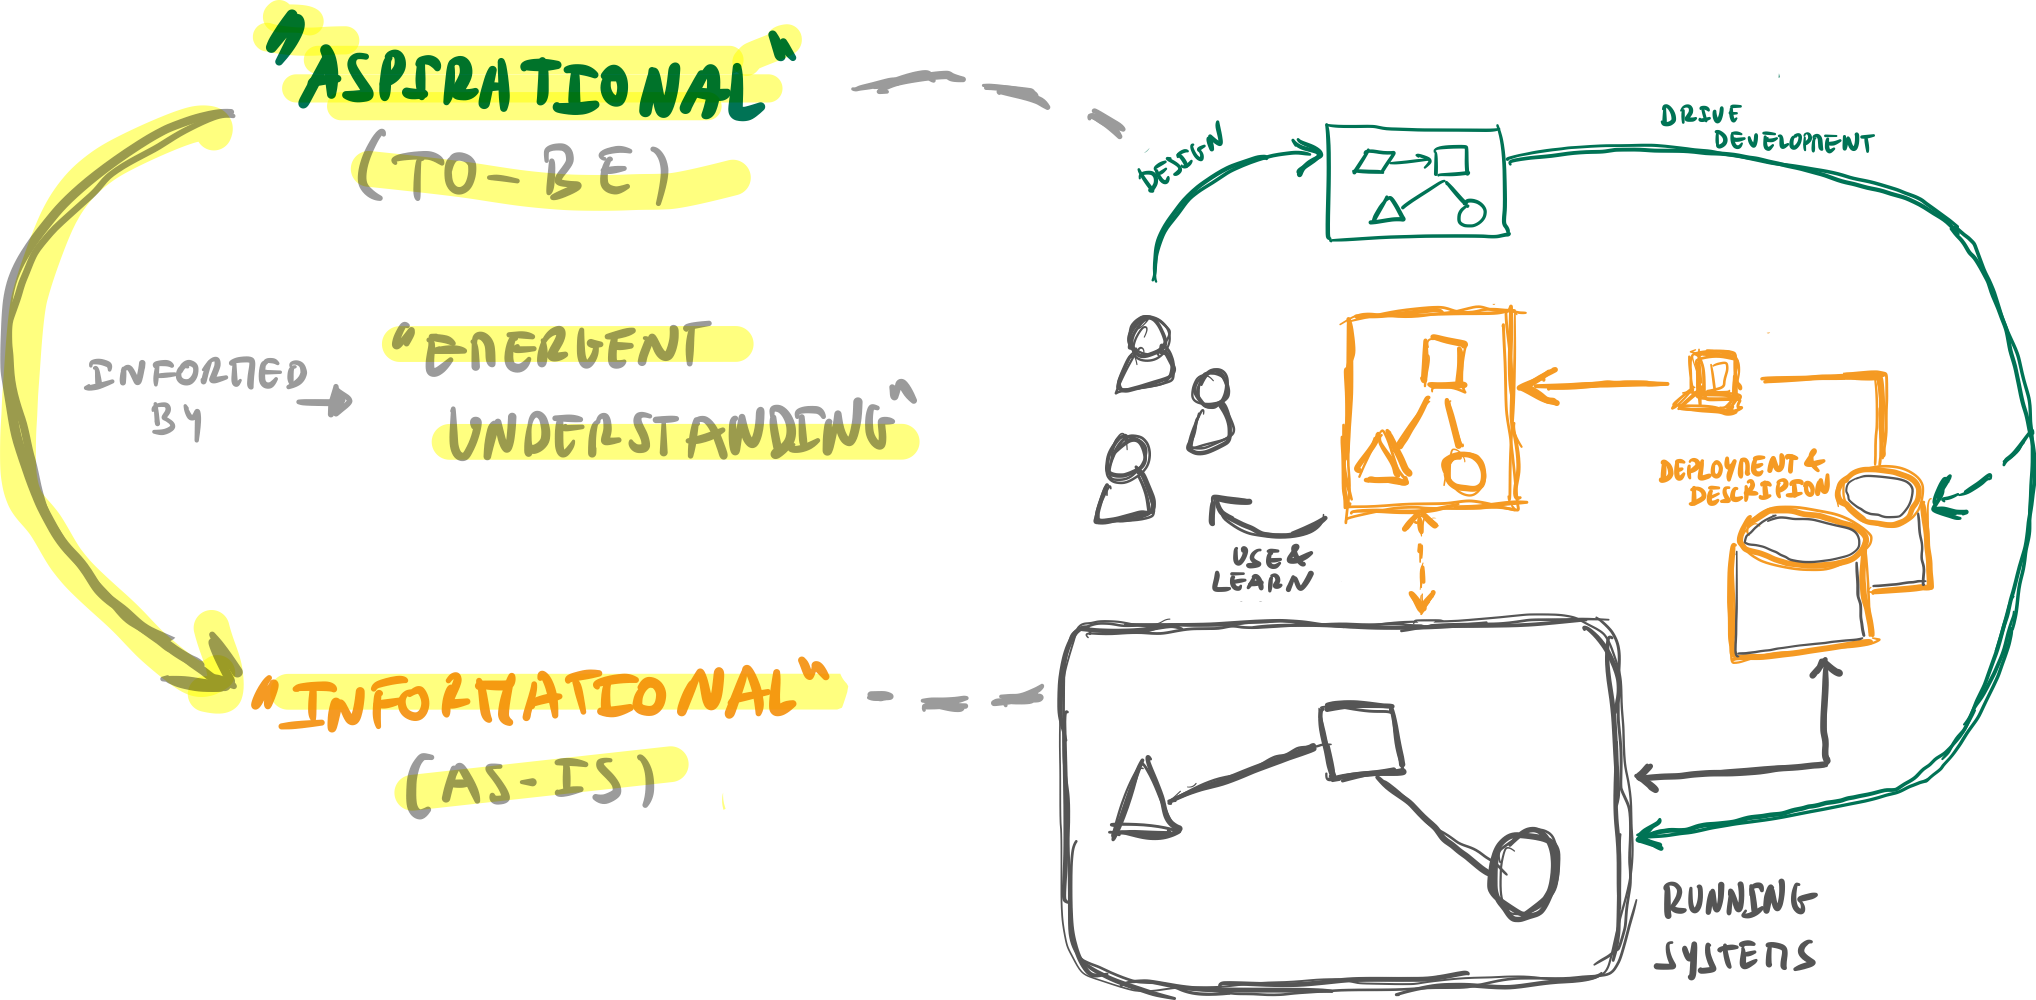
In this section, I want to reflect on how automated generated architecture visualizations can relate to and empower more classic approaches to architecture visualization: manual diagraming and visualizations. I consider we should stop using manual diagraming to capture the state of the running systems architecture. That is not scalable and quickly leads to “model-reality mismatch” problems. Furthermore, the people doing those “manual diagrams” tend to have difficulty keeping up with the changes around them. However, manual diagramming/visualizations will still have an essential space in our practices. In the following, I reflect on that. Still, first I want to introduce a very interesting framing of two types of practices and perspectives on architecture visualization and documentation: “informational architecture” and “aspirational architecture”.
Informational architecture & aspirational architecture
A few years ago I saw this amazing tweet by Nat Price [Informational-Aspirational-Architecture].
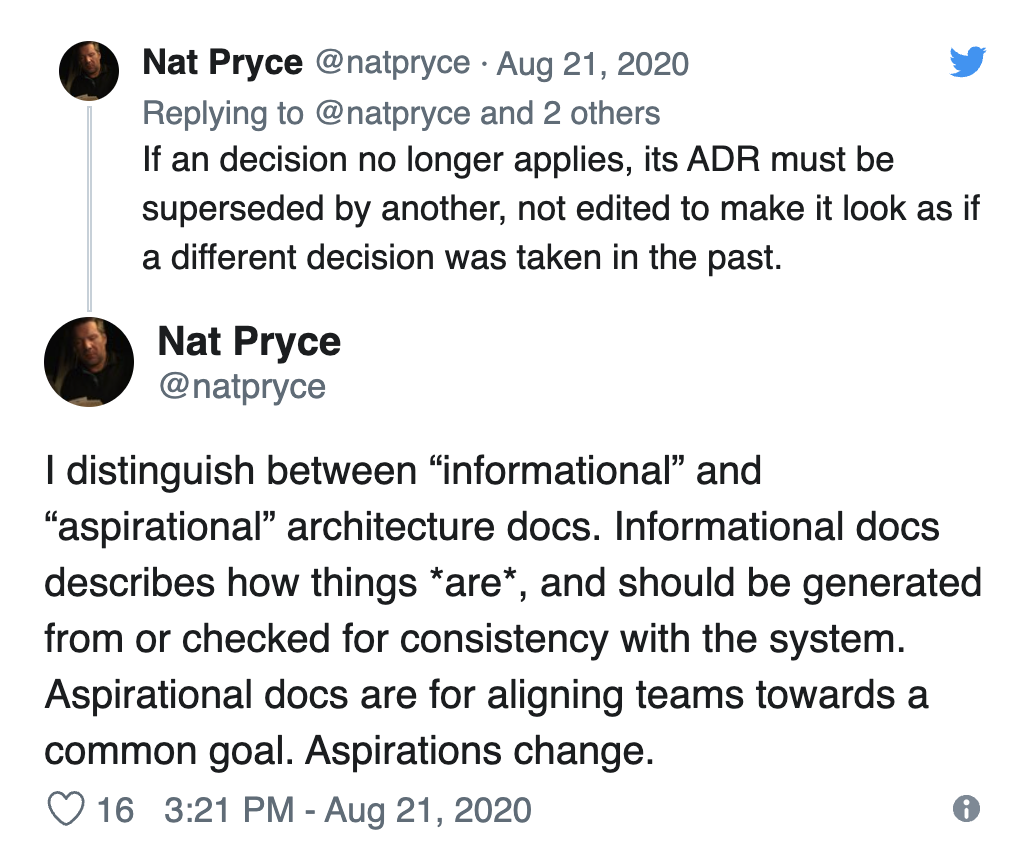
I love Nat’s framing and have used it successfully in many discussions. I think it makes explicit the fact that we should embrace we should have different approaches to architecture visualization (and documentation, as Nat says). When capturing the currently deployed system architecture (what he calls “informational architecture”) we should use one approach. When visualizing to design evolution of the existing architecture (the “aspirational architecture”) we should use another. These are two different perspectives and purposes, and as such, we should accept we use different practices, namely:
- Informational architecture: is about “describing how things are”, i.e., compiling and generating an overview of the deployed system architecture. It should always be generated from (or checked for consistency against) the running systems. The reason is that such up-to-date and trusting information allows us to understand how the landscape is at any moment in time.
- Aspirational architecture: is about “aligning teams towards a common goal. Aspirations change”. So, aspirational architecture is about the design and learning process when defining options to create something new or evolve an existing thing. It is essential to emphasize the aspect of “aligning the teams”. The activity of sketching diagrams plays a crucial role in discussing, designing, and align on what are the options to proceed. Here we are shaping how to drive the development of our systems, i.e., it is about aspiration.
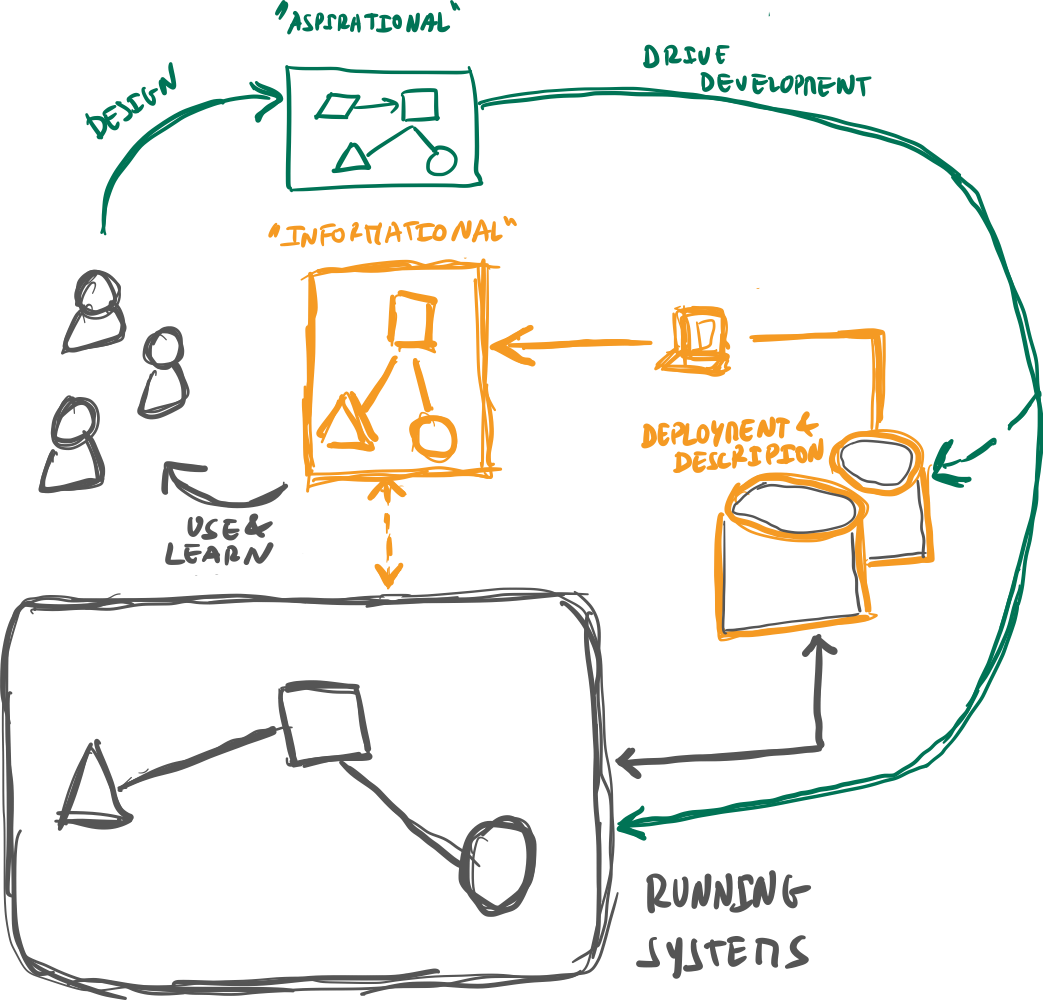
The following figure shows the two perspectives and how they can fit within the framing shared in previous sections.
Emergent understanding
Organizations should leverage these two practices and perspectives to their advantage since they complement each other and can enable better support for evolving our systems. Their joint practice enables powerful mechanisms to amplify teams’ abilities to find better options to evolve their architectures. The following diagram depicts how to use these two perspectives in conjunction.
Automated informational architecture (as framed in the previous sections, with always up-to-date view of the running systems) provides an overview of the existing and deployed architecture in our (team) scope of work. It also allows for further insights into other scopes of work, for example, related scopes that may be doing something relevant to accomplish or shape our aspirations. Those insights are difficult to capture in classical manual approaches to informational architecture. When we have automated approaches informing the aspirational architecture, we unlock the ability to learn and respond more continuously (as accessing information becomes more straightforward). That richer set of insights enables what I call: “emergent understanding”. Emerging understanding is about the ability to discover things that we would not previously see and capture. These new insights and information allow us to consider new design options. Those new options become enablers of more and (possibly) better aspirational architecture designs since we have more information and context at our disposal. Furthermore, those new insights also open doors to interactions that previously may not have happened. For example, such as reaching out to a team, we noticed providing functionality that could help us improve or accelerate our design.
Going beyond technical systems visualization
I consider that the ideas and developments shared in this article are unlocking more sustainable ways of designing and evolving our technical systems architecture. In particular, I think the ability to have a more “emergent understanding” from the higher degrees of visibility and accuracy will allow teams to discover new options for evolution. Those will help scale the improving the overall system, as opposed to the more classic “siloed optimizations” that are still prevalent in many organizations. These elements also provide foundations to increase our understanding of elements outside the technical systems. For example, we can start looking at the existing teams’ interrelations. Those learnings will provide more insight into the “sociotechnical boundaries” in our organization and products. This broader perspective is pivotal to improving the design and building of better and more sustainable architectures.
Why do I think that? Because the way we architect our teams and their interactions will directly influence how our technical systems architecture will be built and evolved. This is Conway’s Law [Conways-Law]: “any organization that designs a system (defined broadly) will produce a design whose structure is a copy of the organization’s communication structure”. The bottom line, we should leverage the aspects of the social system in our languages to discuss systems architecture visualization and understanding. That richer language will allow us to look at the sociotechnical systems, not just the technical system. This topic still requires some development, but many things are happening that will undoubtedly help move this forward.
Final Note
This is the first article of a series on this topic. In the following article, I will explore the topic of the last section and reflect on my learnings, developments, and perspective. In particular, I will look at the ideas discussed in this article and how to integrate the “social system” perspective, i.e., be able to visualize and understand the sociotechnical systems architecture.
I have been researching the topic of sociotechnical systems architecture visualization and understanding for a while (esilva.net/sociotechnical). This is also a topic I am now actively helping companies with my consulting services (esilva.net/consulting). If any of this is of interest to you, feel free to contact me or arrange a free 30 min check-in.
References
- [C4] C4 Model, Simon Brown
- [Structurizr] Structurizr, Diagrams as Code 2.0, Simon Brown
- [Backstage] Backstage - Software Catalog and Developer Platform, Spotify
- [Sociotechnical-Silva] Sociotechnical Systems Evolution & Architecture, Eduardo da Silva
- [Spotify-ArchitectureVisualization] Software Visualization — Challenge, Accepted, Spotify Engineering
- [Team-Topologies] Team Topologies, Matthew Skelton and Manuel Pais
- [Team-Topologies-Diagramming] Team Topologies Diagramming, Team Topologies
- [Software-Parade] Software Parade, Kristel Nieuwenhuys
- [Informational-Aspirational-Architecture] Informational and Aspirational Architecture, Nat Pryce
- [Conways-Law] Conway’s Law, Melvin Conway
Tools and Products
- Aplas - platform for visualizing software landscapes using mapping paradigms. Big focus on flexible and customizable visualizations of software systems landscapes (including creating different annotations on the “software map”) to highlight different insights for different people in the organization.
- Backstage - Spotify’s open-source software catalog and developer platform. It is quickly becoming one of the major platforms to support software cataloging at scale in organizations. It follows a plugin architecture, which allows adding support to all sorts of tools on top of it to perform different things (e.g., ingestion of data, visualizations, etc.).
- Structurizr - Tools developed by Simon Brown to create software architecture diagrams and documentation based on the C4 Model. Structurizr lets you create a single model with multiple views, which can be rendered in many tools.
Conversation
“The (r)evolution... will be visualized in realtime”
— Eduardo da Silva (@emgsilva) October 11, 2022
Automated software architecture visualization enables orgs & teams to “see more & better” and shape new options to design and evolve their systems.
Check out my latest article on this topic 👇🏻https://t.co/OUbbf5vC0O
ℹ️ I offer consulting services and products on this topic
If you are looking for help on these topics feel free to contacting me, and/or check my consulting and products pages for more details on how I may be of help.